Place Matters: Understanding Community-Level Needs
Place matters. Demographics matter. Health happens in the community. That’s why at Unite Us, we invest in understanding what drives community-level needs and their impact on individuals first, before diving into solutions. We know how critical it is to understand community needs geographically in order to serve a community equitably. Our Community Needs Map (CNM), built by the Unite Us Data Science and Data Analytics teams, is a reflection of that understanding. The CNM allows our network partners to develop targeted intervention strategies that have the ultimate goal of improving community health outcomes.
How it works
The CNM is a map built by modeling data from the U.S. Census Bureau’s American Community Survey and the USDA Food Access Research Atlas. It incorporates data tied to social determinants of health (SDoH) — representing sociodemographics, economic stability, affordable and adequate housing, and health and healthcare access. An analysis by the Unite Us Data Science team helped us zero in on the critical metrics for healthy communities, and resulted in a set of indices: socioeconomic status, rural vulnerability, social isolation, and more. We then combined these indices into one Composite Index, which allows a user to visualize and understand the level of vulnerability in a community using a single number.
The Composite Index ranges from 0.0, which indicates a community with low need; to 1.0, which indicates a community with high need.
Why it matters
Displaying information from our Composite Index at the county level, our publicly available CNM is a unique starting point for assessing social needs in any community in the U.S. The CNM can help you:
- understand what social and resource needs might exist in your community at the county level, and
- prioritize resource allocation based on where needs are greatest.
Let’s take a deeper look
High social vulnerability in communities has real-world implications, such as increased hospital readmissions and emergency department visits. Quantifying those can help you gauge public health and community needs.
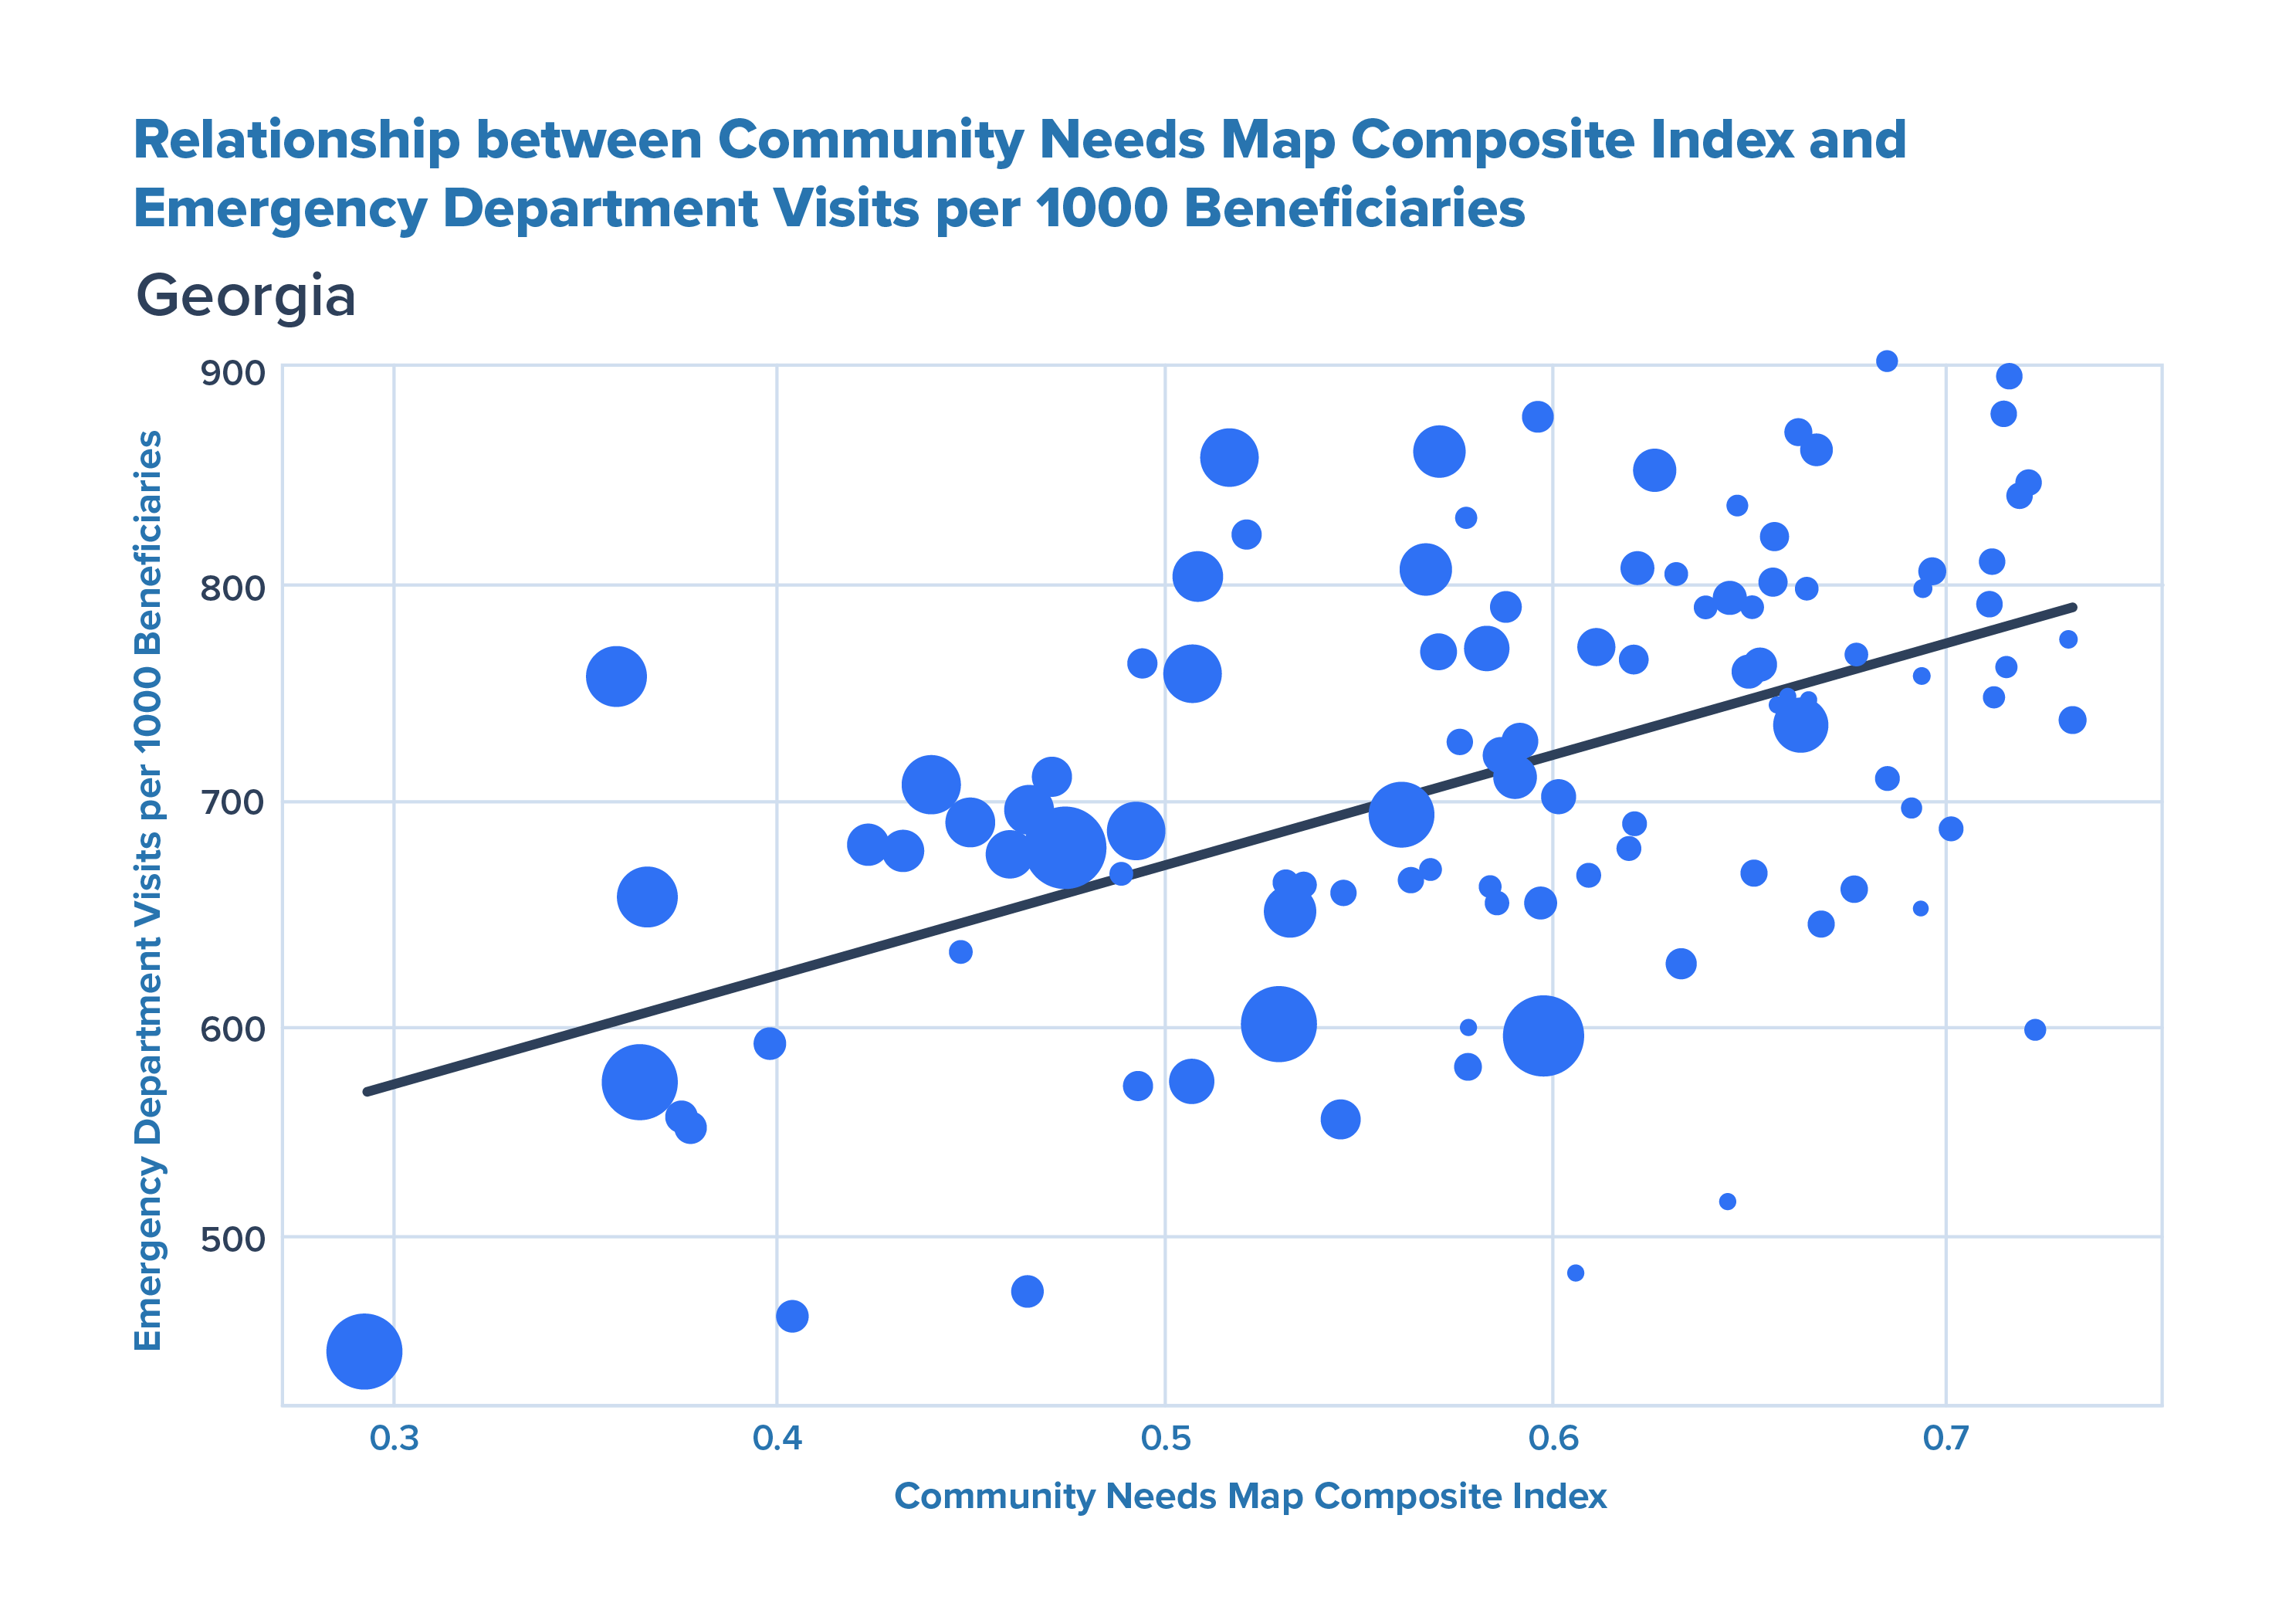
We found a statistically significant correlation between the CNM Composite Index and emergency department visits. Two counties in Georgia provide a good example. In Richmond County, the Composite Index score is 0.6. Based on variables used in this index (sociodemographics, economic stability, affordable and adequate housing, and health and healthcare access), Richmond County is a high-need community. Right next door to Richmond is Columbia County, which has a very low composite score of 0.29, indicating lower social needs in that community. This means that relative to Columbia County, Richmond County presents more opportunities for social care interventions.
In the graph below, you can see the correlation between the CNM Composite Index and emergency department (ED) visits by Medicare/Medicaid beneficiaries in the state of Georgia. For every 0.1 increase in the CNM Composite Index, there is an increase of 51 ED visits per 1,000 Medicare/Medicaid beneficiaries. With the average cost of an ED visit at $1,010 (in 2018), that means a 0.1 increase in our Composite Index equates to a total cost of $51,510.
Richmond County’s higher CNM Composite Index score and greater number of ED visits per 1,000 Medicare/Medicaid beneficiaries shows not only that a higher Composite Index score is related to higher ED utilization, but also to higher medical costs.
Using the CNM, we also identified statistically significant relationships between the Composite Index and other health variables. For example, a 0.1 increase in the CNM Composite Index is correlated with a 0.025 increase in a community’s Hierarchical Condition Category (HCC) score, an index created by the Centers for Medicare & Medicaid Services to calculate risk scores for aged and disabled Medicare beneficiaries. Similarly, a 0.1 increase in our index is correlated with a $254 increase in Standardized Per Capita Costs. These related, statistically significant metrics suggest that the CNM indices can be powerful tools for stakeholders trying to understand what’s driving both health and social needs in a community.
Putting data to action
The CNM is an excellent starting point to understand how community needs might differ at the county level across the United States. Even at the county level alone, the potential impact of utilizing the CNM is clear. Unite Us has built into the CNM the capability to drill drown to see index scores at the Census tract level, allowing for even greater understanding of granular differences in community need.
The burdens of living in a high-need community directly and severely impact health. The CNM charges us to allocate resources to the communities that need it most. Partner with Unite Us to learn more about how the CNM can help you target needs in your neighborhoods.
About Unite Us
Unite Us is the nation’s leading software company bringing sectors together to improve the health and well-being of communities. We drive the collaboration to identify, deliver, and pay for services that impact whole-person health. Through Unite Us’ national network and software, community-based organizations, government agencies, and healthcare organizations are all connected to better collaborate to meet the needs of the individuals in their communities.